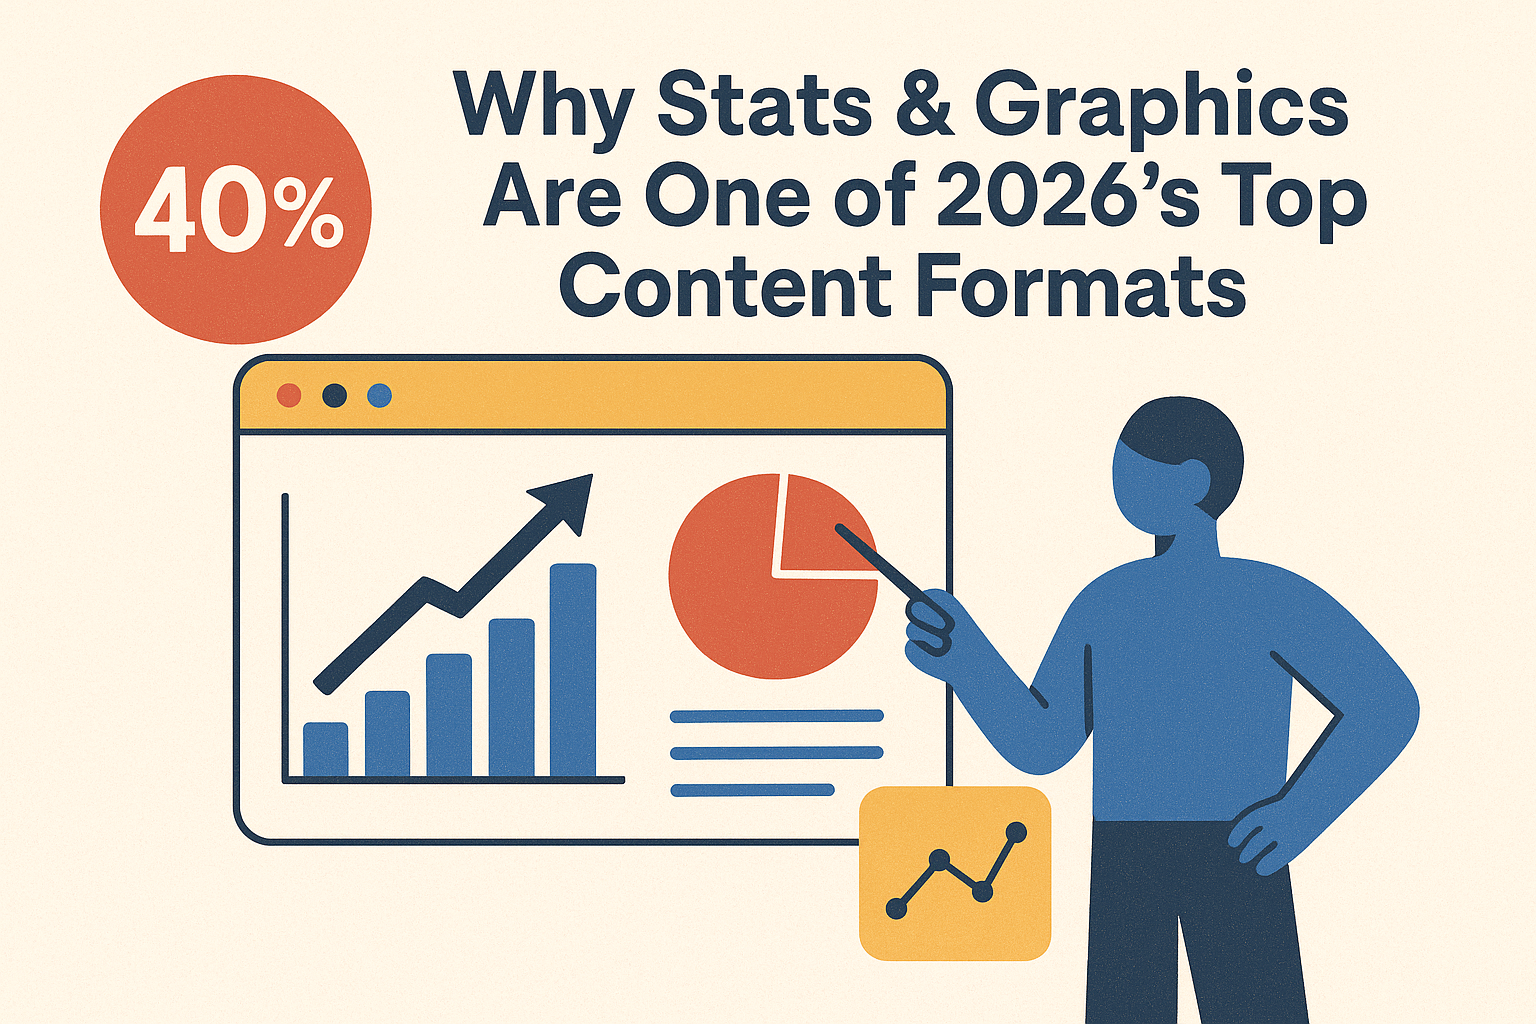
In 2026, attention is scarce, scrolling is faster, and patience is lower than ever. As a result, campaigns that rely on long explanations often lose viewers before the message lands. Instead, audiences gravitate toward content that communicates value instantly. Consequently, stats and graphics content have become one of the most effective ways to stop the scroll and deliver meaning at a glance.
Moreover, platforms increasingly reward clarity and retention. Therefore, content that combines numbers, visuals, and context performs better across feeds. Rather than asking users to interpret long captions, stats and graphics do the thinking upfront—making information easier to consume, save, and share.
Why Stats Instantly Capture Attention
Numbers create structure in a chaotic feed. More importantly, they signal usefulness within seconds.
- Immediate clarity: Viewers understand the takeaway without extra effort
- Authority boost: Data-backed posts feel credible and trustworthy
- Faster processing: Visualized stats reduce cognitive load
- Scroll-stopping power: Numbers naturally break visual patterns
- High save rates: Useful stats encourage bookmarking
Altogether, stats transform abstract ideas into concrete insights that audiences can grasp instantly.
How Graphics Turn Information Into Shareable Content
While raw data can feel dry, graphics make it accessible and engaging. As a result, information becomes easier to remember and easier to pass along.
- Visual hierarchy: Layout guides the eye to the key message
- Brand consistency: Reusable graphic styles build recognition
- Platform flexibility: Graphics work across carousels, reels, and stories
- Silent consumption: No audio is needed to understand the point
- Cross-audience appeal: Visuals transcend language and context barriers
Because of this, graphic-based posts often outperform text-heavy formats in reach and engagement.
How Creators Are Using Stats and Graphics Content in 2026
Creators are no longer posting visuals just to look good. Instead, they design graphics to educate, persuade, and retain attention.
- Single-stat slides: One insight per frame for clarity
- Context-first captions: Explaining why the stat matters
- Series formats: Turning data into recurring content pillars
- Minimalist design: Letting numbers lead, not decoration
- Insight-driven hooks: Leading with “X% of users…” or “Only 1 in 5…”
Consequently, feeds feel smarter, more intentional, and easier to navigate.
Why This Format Isn’t Going Anywhere
Stats and graphics work because they respect the audience’s time. In a landscape filled with noise, they offer structure, clarity, and value in seconds. Therefore, brands that rely on visualized insights build trust faster and maintain relevance longer.
At the same time, this shift is reshaping social media content itself. Instead of emotional hooks alone, data-backed visuals now anchor credibility and memorability. In 2026, the strongest feeds will balance creativity with clarity—using stats and graphics not just to inform, but to lead conversations.


